 Since we added a very popular Infographics Gallery to our content spreading tools, our users have been asking us to provide some tips on how to brainstorm, create and promote infographics. So that’s what we were talking about on our weekly Twitter chat:
Here’s the Twitter chat summary with all the tools and resources we have shared:
Step 1: Brainstorming Infographics
The first step in brainstorming your future infographic is to find a great idea. What you need to do here is to think about your previous research and your overall expertise
- Think of your previously published, most indepth articles, ebooks, white papers, etc. Example: Here’s how I re-used my own research for @Mashable guest post into an infographic on social media spamming.
- Think about most recent trends within your niche. For social media niche, for example, this can be newest features introduced for Facebook, Twitter, Google Plus, etc. Think how you could explain how things work in a clearer way. Cheatsheets work best for that! Example: here’s a very popular cheatsheet on Google + which was created shortly after the social network had been born.
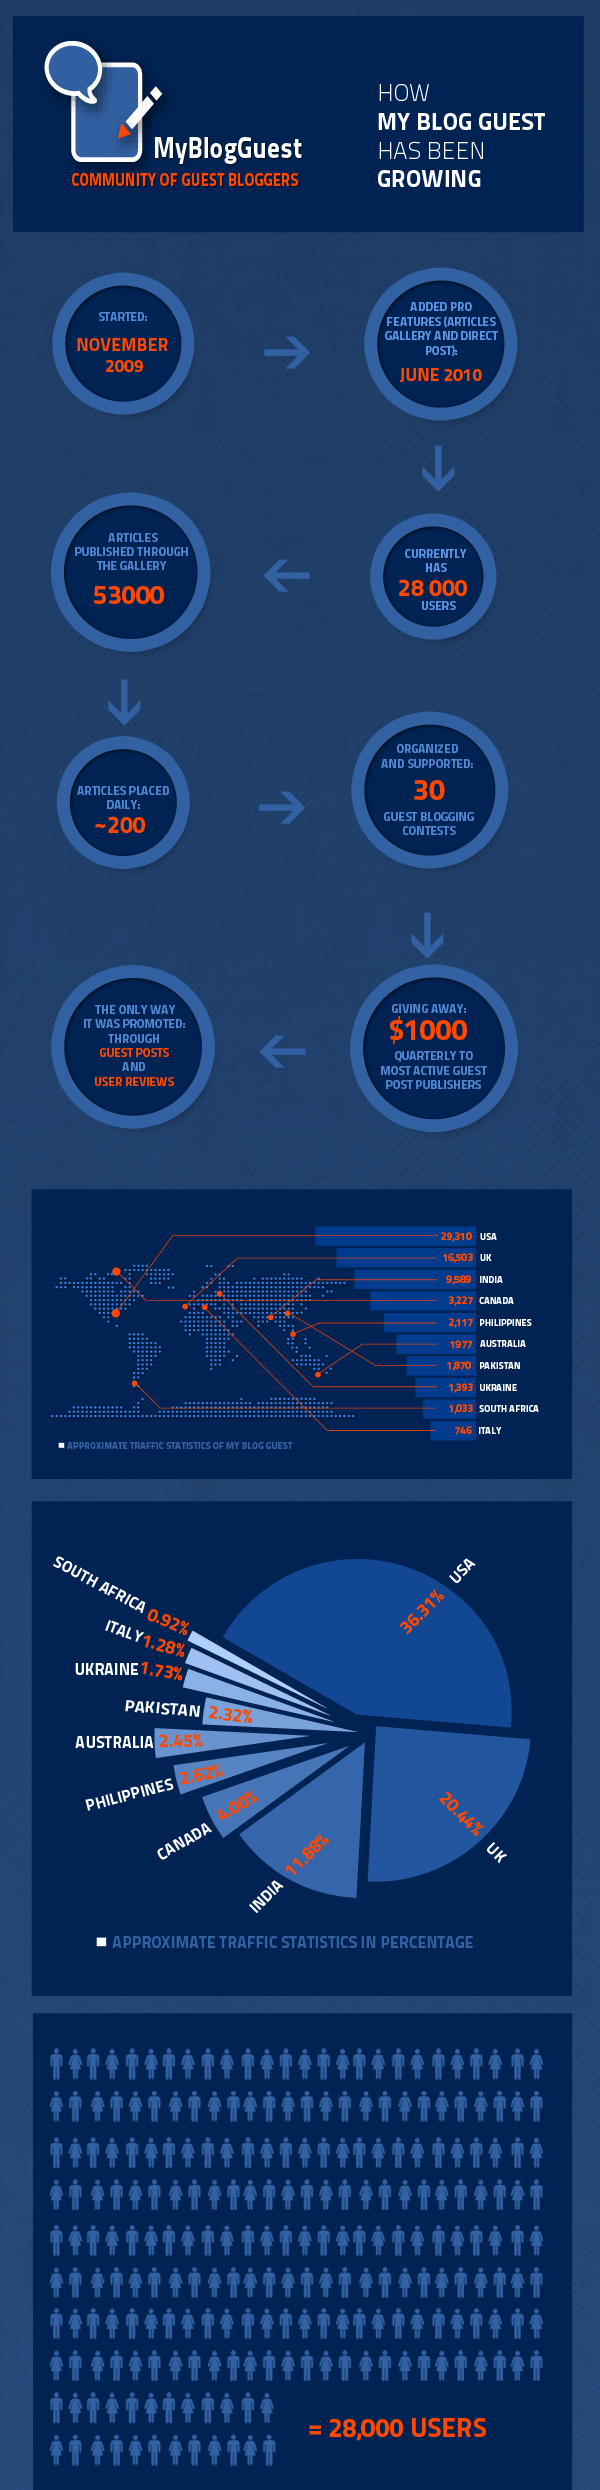
- Think about the stats you can sum up and visualize. Example: Our official infographic revealing MyBlogGuest growth and stats so far!
- Monitor q&a sites to see what people have hard bad time figuring out. Search Quora and LinkedIn answers for general sites. Find niche q&a networks: for example SEOmoz answers for SEO / social; MakeUseOf answers for tools and tech, etc. Example: Ever since official Twitter Retweets were introduced, people (especially newbies) had bad time figuring the difference between Retweet and RT @, so I created an infographic explaining it.
The main point: the infographic should not be created for the sole point of making the data beautiful. It should be useful!
One more tip: check out these blogs for plenty of infographic inspiration!
Step 2: Creating an Infographic
Of course, your best bet is to find a good designer for that (I used odesk.com but there can be many other resources for that) but you can start by experimenting with something fun and basic you can cerate yourself.
- Here’s the post I did on types of infographics and tools you can use to create them
- Create “Periodic tables” organizing your niche terms (use this a blank periodic table for you to fill in)
- Create a “Map” visualizing the spread of products or how they are being used worldwide (check out these Free Vector World Maps Collection: the huge collection of high-resolution world map images in various colors and textures)
- Try Venn Diagrams which are the easiest to create but need a fresh idea. Here are some tools to help you put your idea into practice.
- Create flow charts to better explain any process. Creately is a great tool for that (here’s our own guest blogging flow chart as an example)
- Here’s another article with more infographic tools (especially for branding)
- Here’s one which comes highly recommended (paid) Piktochart
Even more resources:
- Here’s the awesome collection of visual hooks and elements for your future infographics: learn to create beautiful columns, trendy lines, beautiful charts, etc
- Here are plenty of awesome Photoshop templates and icons to use in your infographics (or to just get inspired)

Step 3: Promoting Your Infographic
Simply creating a great infographic and waiting for people to come is not the best way to reward yourself for your efforts. Here are a few things you can do to help it go popular:
- Use our Infographics Gallery to let more bloggers re-publish it. Here’s the video tutorial of that feature.
- Once your infographic is guest-published, use our HELP NEEDED forum to get some shares each time. Here’s another video on it. And here’s a more detailed video from our awesome social media mod!
- Pitch it to the Infographic Distribution sites. Try [inurl:submit infographic] search on Google. Also feel free to use our own spreadsheet we were using to promote our official infographic (it has contact details and terms pre-filled).
Per users’ requests next time we’ll talk about finding great articles in our Articles Gallery and making an offer! Join us next Thursday at 11 a.m. EDT / 3 p.m. GMT!
>>> Note: Join us each Thursday at 11 a.m. EDT / 3 p.m. GMT to talk guest blogging and content marketing. Just follow and Tweet #MyBlogGuest hashtag<<<
Joseph
Latest posts by Joseph (see all)
- Chatting Guest Blogging at #Pitchboxchat - December 19, 2018
- How to Collaborate on Content: Co-Create, Interview and Find Guest Bloggers! #BizapaloozaChat - December 5, 2017
- Ann Smarty Talking Influencer Marketing at #BW_Chat Twitter Chat - February 26, 2016
Howie
Here’s a pretty neat website that can help you create infographics.
http://infogr.am/
It’s not my site but worth checking out. Of course my site is worth checking out too =)
Ann Smarty
Looks good! Thanks for sharing!
kevin
What are the pros and cons of putting an infographic on just your own blog?
Ann Smarty
I’d say that the sole purpose of creating an infographic is to make it “re-published”. Therefore you often see an embed code following the infographic. Otherwise, it doesn’t make sense. That’s my own opinion though. Other people may ve creating infographics for other purposes…
Howie
Kevin, one of the things that an infographic can help with is time on the site. Whether you’re the creator or just reposting the infographic it will help increase this metric. Infographics can take a while to digest.
Also, try pinning it on pinterest. You’d be surprised at the amount of traffic it can generate sometimes.
pinakin
I would like to know from where do you get this images and vectors for building infographics ?
Alex
Well, step 3 of promoting infographics, in my opion, could be the most important. Of course, infographics really works in improving your backlink quality as wel as bringing traffic to your site. Well, you can see the list of over 100 infographics galleries here for free: http://infographicssubmit.com/. More details, this site already sorted these galleries in terms of Page rank, so quite convenient. In addition, you can also ask for their service that help manually submit your own infographics to about 25 galleries – in case you’re too busy or you found it boring and time-consuming to submit infographics to hundreds of galleries.
Thanks for your post and good luck.